IT Services – Quick Links

New to Montclair?
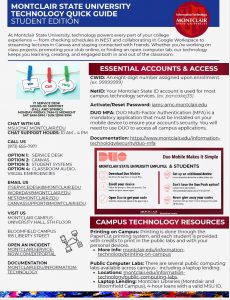
Click below for a quick Student IT Guide!
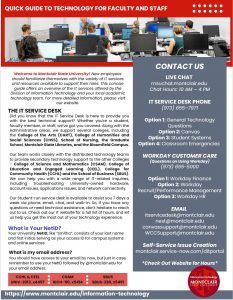
Click below for a quick Fac/Staff IT Guide!
News and Events
- One Login. Any Device. Meet Your New Virtual Desktop.Monday March 23, 2026

- End-to-End Testing Begins on Workday Student ProjectThursday March 19, 2026

- macOS Tahoe Release for Mac Operating SystemsTuesday November 18, 2025
- Update: AV Special Event Staffing and Usage ExpectationsFriday November 7, 2025
- Print Smart. Save the Planet.Saturday November 1, 2025

- Windows 10 End of Life: What It Means and How to PrepareFriday October 17, 2025

Computer Lab Availability
University Hall 5007 Public Lab39 of 39 available
Sprague Library 132 Laptop Loaners77 of 77 available
About Us
The Information Technology Division is responsible for building, maintaining and supporting the University’s computing infrastructure. We support a wide range of technologies, encompassing enterprise servers and software, the University’s wireless and wired networks, campus phone networks, and desktop computers.
We also provide direct support to end-users – both employees and students – and run an assortment of computing and printing labs on campus.
Our goal is to make available the technical resources our students, faculty, and staff need to build a connected and effective learning environment for the information age.
Getting Help
The IT Service Desk link is ready to assist you if you’re having trouble connecting to the network, accessing any of the University’s online services, or obtaining needed software for your leased workstation.
- Phone
- 973-655-7971
- ITservicedesk@montclair.edu