
An Audit of Food Security, Perceptions, and Experiences of Students at Montclair State University between 2018 and 2022, organized by Chris Snyder, MPH and Dr. Lauren Dinour, DrPH, RD, CLC.
Introduction
The Hunger Free Task Force
In 2016, a preliminary student-led survey identified a notable student need for food and other household necessities. As a result, in 2016, Montclair State University became the first four-year university in New Jersey to open an on-campus food pantry: the Red Hawk Pantry. In 2019, University researchers Chris Snyder and Dr. Lauren Dinour initiated the first administration of a standardized food security survey to the University’s student population. This survey was intended to inform program developments to projects overseen by Snyder and Dinour. Information from this survey highlighted areas of student need, and contributed to the formation of the Montclair State University Campus Hunger Free Task Force. The Hunger-Free Task Force is composed of University organizations and staff dedicated to addressing the issues adult students face while pursuing higher education at Montclair State University.
This report was authored for the Montclair State University Campus Hunger-Free Task Force, and its constituents: the Montclair State University Campus Community Garden, the Montclair State University chapter of the Food Recovery Network, the Red Hawk Pantry, and the Office of the Dean of Students. It is intended to provide guidance to these University organizations in identifying and addressing student food needs, including, but not limited to: food insecurity; lack of access to culturally, religiously, allergically, or nutritionally appropriate food; and emergency food needs. This report provides necessary updates to the University statistics on student food security, including the prevalence of student food insecurity and student perceptions of the campus food environment. This report also sets, and contributes to, a baseline measurement which has been standardized to allow for comparison between this and other populations (i.e., by utilizing a modified version of the standardized USDA Household Food Security Survey Tool), and allows for follow-up surveys to be performed in order to measure progress made towards addressing student food security by the above mentioned campus entities and others, as identified.
Timeline
Below is a timeline of events related to the Montclair State University Campus Hunger Free Task Force and its component organizations.
- 2016
- Student-led research, as part of a capstone project, investigated student difficulty in purchasing household necessities, toiletries, and food. Montclair State University opens the Red Hawk Pantry, an on-campus food pantry for student use.
- 2017
- The Montclair State University chapter of the Food Recovery Network is established, with Dr. Lauren Dinour as Faculty Advisor.
- 2018
- The Montclair State University Campus Community Garden is established, with Chris Snyder, MPH as Garden Coordinator.
- 2019
- Chris Snyder and Dr. Lauren Dinour initiated the University’s first administration of the USDA Household Food Security Survey Module, a standardized tool for measuring prevalence of food insecurity. This tool is administered yearly.
- Montclair State University responds to research findings and establishes the Campus Hunger-Free Task Force (HFTF).
- 2020
- Beginning of the COVID-19 Pandemic.
- Students leave campus for remote learning.
- 2021
- Montclair State University designated by the State of New Jersey as a Hunger-Free Campus, in acknowledgement of University’s dedication and progress towards addressing student food needs. Montclair State University received a two-year grant of $100,000 from the New Jersey Office of the Secretary of Higher Education to expand hunger-fighting efforts.
- Students return for hybrid instruction on campus in fall.
- 2022
- Students return to campus for in-person instruction.
Interpreting the Audit
Several terms with specific programmatic definitions are used within this report, and are defined below. Please refer to the appropriate definition for each of the referenced data sources.
According to the United States Census Bureau, a household includes all the people who occupy a housing unit (such as a house or apartment) as their usual place of residence. A household includes all of the related family members and all of the unrelated people, if any, such as lodgers, foster children, wards, or employees who share the housing unit. A single person living alone in a housing unit, or a group of unrelated people sharing a housing unit such as partners or roommates, is also counted as a household.
For the purposes of allocating nutritional support services, the United States Department of Agriculture’s Food and Nutrition Service defines a household as all the people who live together, and who purchase and prepare meals together. Households will include some members (such as spouses and most children under age 22) even if they purchase and prepare meals separately. If a person is 60 years of age or older and unable to purchase and prepare meals separately because of a permanent disability, the person and the person’s spouse may be a separate household if the others they live with do not have very much income.
The United States Department of Agriculture’s Economic Research Service categorizes household food security status into four ranges, defined below:
High Food Security — Households had no problems, or anxiety about, consistently accessing adequate food.
Marginal Food Security — Households had problems at times, or anxiety about, accessing adequate food, but the quality, variety, and quantity of their food intake were not substantially reduced.
Low Food Security — Households reduced the quality, variety, and desirability of their diets, but the quantity of food intake and normal eating patterns were not substantially disrupted.
Very Low Food Security — At times during the year, eating patterns of one or more household members were disrupted and food intake reduced because the household lacked money and other resources for food.
An individual that identifies experiencing high food security or marginal food security is considered to experience food security, or be food secure; an individual that identifies experiencing low food security or very low food insecurity is considered to experience food insecurity, or be food insecure.
Montclair State University Student Food Security to Date
Audit Methodology
In 2016, a preliminary student-led survey identified a notable student need for food and other household necessities. This survey raised initial concerns about the state of student food security on campus, and had motivated the University’s initial response to addressing this issue. This survey had not utilized the USDA survey module or other comparable standardized scale, and the researchers identified a shortcoming in the information available to guide further program development.
The audit performed during the 2018-2019 Academic Year represents the first attempt at Montclair State University to measure student food security using the USDA’s standardized US Adult Food Security Survey Modules. As a result, the authors intend to use this data as a baseline measurement using a standardized tool for comparison to other populations, as well as a comparison for measuring changes in student food security over time.
Recruitment
This audit, released between 2019 and 2022 collected feedback from respondents regarding their level of food insecurity during the academic semester. The study collected a baseline measurement of student food security during the course of an academic term, which is comparable between survey iterations and other measurements using the standardized USDA tools.
During the study period, email invitations to participate in an online survey were sent to all students attending Montclair State University. Potential respondents were invited to take an anonymous online survey, administered via the online survey platform Qualtrics. The survey asked questions that were aimed at identifying food security status during the current semester, as well as identifying student opinions and experiences of the Campus, and surrounding, food environments. The survey was opened 30 days after the beginning of each semester that it was administered, and remained open until the end of instruction and the beginning of the final examination period. Invitations to participate were sent at least twice per semester.
The food security audit was composed of a modified version of the USDA’s US Adult Food Security Survey Module, which is intended to be administered to the adults in a given household. The language of the tool was modified in order to better reflect the target audience of college-aged adults, who are more likely to live in a household of one individual, based on the USDA definition provided in the introduction.
Additional questions were added to the survey tool in order to collect demographic traits, assistance program participation rates, and additional information about possible factors impacting student food security, as well as capturing student perceptions of the campus and local food environment. Specific questions about the extent of the COVID pandemic and returns to campus were asked in following survey iterations (2020-2022).
Potential respondents were considered to be eligible to participate in the survey if they were actively enrolled as a student during the academic semester the survey was administered. For this survey, University staff and faculty members were not recruited; however, student workers, such as Graduate Assistants (GA’s) or Teaching Assistants (TA’s) were eligible, due to their student status. There were no exclusionary criteria for active students.
Student responses to the adapted USDA US Adult Food Security Survey Modules were coded according to the USDA’s guidance, in order to determine each respondent’s level of food security during the recorded academic semester. Students designated as having high food security or marginal food security were classified as being food secure, while students designated as having low food security or very low food security were classified as food insecure. Definitions of these classifications are provided in the introduction.
Analysis
Statistical tests and analyses were run comparing responses between students who were identified as being Food Secure and Food Insecure using the R language and environment for statistical computing. The results of these analyses are presented in the following sections. All statistical test results are rounded to two digits for ease of presentation.
Student Food Security Status To Date
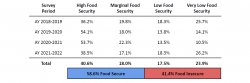
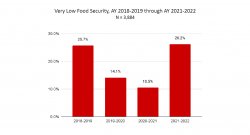
Between 2018-2022, 3,884 responses were collected from non-unique students who responded to the survey during at least one collection period. During each survey period, respondents were asked about their current food status.
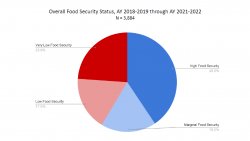
Of the 3,884 respondents, 2,277 (58.6%) students were identified as being food secure during the semester they responded to the survey. Specifically, 1,578 (40.6%) students suggested having high food security and reported no issues with accessing food, and 699 (18.0%) students suggested having marginal food security and reported at least one issue with accessing food, but were still considered to be food secure.
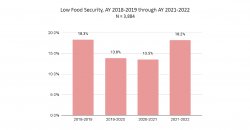
The remaining 1,607 (41.4%) students were identified as being food insecure during the semester they responded to the survey. Specifically, 678 (17.5%) students suggested having low food security and reported reducing the quality of the food that they ate, and 929 (23.9%) students suggested having very low food security and reported reducing the amount of food that they ate.
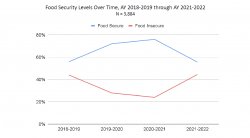
The distribution of student food security status for the duration of the research project has been tabulated below and is graphed.
Past Audits
The Montclair State University Campus Community Garden, and its partner organizations, are working to better understand the nature of the need of students attending Montclair State University.
During the Spring 2019 Semester, students were invited to participate in research about food security on campus. A total of 628 students completed the survey. The survey included a modified version of the USDA Adult Food Security Survey, modified to better address an audience of university students; the survey asked questions that are intended to identify food security during the duration of the Spring Semester. The data suggest that over 4 out of every 10 students who responded to the survey may be Food Insecure during the academic semester, and may not have access to enough food, or have only low quality foods, on a regular basis.
The Montclair State University Foodscape Audit
A Summary of Food Security of Students Within the Campus Foodscape, organized by Chris Snyder, MPH and Dr. Lauren Dinour, DrPH, RD, CLC
Introduction
This audit was authored for the Montclair State University Campus Community Garden, the Montclair State University chapter of the Food Recovery Network, and the Red Hawk Pantry, in order to provide guidance to these campus organizations in identifying and addressing student food needs. This audit provides necessary updates to the campus statistics on student food security, including the prevalence of student food insecurity and student perceptions of the campus foodscape.
To conduct the audit, students were invited to participate in an anonymous online survey during the Spring 2019 Semester. The survey asked questions that were aimed at identifying food security during the duration of the Spring Semester, and during the duration of the prior Winter Session / Winter Recess Period. A total of 628 students responded throughout the course of the Spring ’19 semester.
Please see the definitions used in the audit to refer to food security below. According to the USDA, the varying levels of food security are defined as the following:
- High food security
- Students had no problems, or anxiety about, consistently accessing adequate food.
- Marginal food security
- Students had problems at times, or anxiety about, accessing adequate food, but the quality, variety, and quantity of their food intake were not substantially reduced.
- Low food security
- Students reduced the quality, variety, and desirability of their diets, but the quantity of food intake and normal eating patterns were not substantially disrupted.
- Very low food security
- At times during the semester, eating patterns of students were disrupted and food intake reduced because the respondent lacked money and other resources for food.
An individual that expresses high food security or marginal food security is considered to experience food security, or be food secure; an individual that expresses low food security or very low food insecurity is considered to experience food insecurity, or be food insecure.
Please note that some definition text has been adapted for this audit to better refer to a single student respondent, as compared to a household of more than one individual.
Student Food Security
Spring 2019
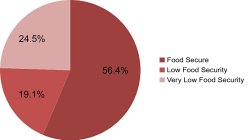
During the course of the Spring ’19 Semester, 354 (56.4%) students were food secure.
Specifically, 243 (38.7%) students suggested having high food security and reported no issues with accessing food; 111 (17.7%) students suggested having marginal food security and reported at least one issue with accessing food, but are still considered to be food secure.
During the course of the Spring ’19 Semester, 274 (43.6%) students were food insecure.
Specifically, 120 (19.1%) students suggested having low food security and reported reducing the quality of the food that they eat; 154 (24.5%) students suggested having very low food security and reported reducing the amount of food that they eat.
Figure 1. Spring 2019 Student Food Security (n = 628)
Winter 2018 Recess
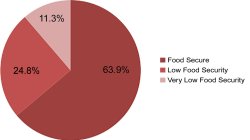
During the course of the Winter ’18 Recess, 401 (63.9%) students were food secure.
Specifically, 245 (39.0%) students suggested having high food security and reported no issues with accessing food; 156 (24.8%) students suggested having marginal food security and reported at least one issue with accessing food, but is still considered to be food secure.
During the course of the Winter ’18 Recess, 227 (36.1%) students were food insecure.
Specifically, 156 (24.8%) students suggested having low food security and reported reducing the quality of the food that they eat; 71 (11.3%) students suggested having very low food security and reported reducing the amount of food that they eat.
Figure 2. Winter 2018 Student Food Security (n = 628)
Key Takeaways
Of the 628 students surveyed, 274 (43.6%) of them reported experiencing food insecurity during the Spring 2019 Semester.
Students experiencing food insecurity were more likely to be younger than their food secure peers. It is possible that younger college students have less experience in successfully navigating a foodscape on their own, compared to their older peers.
Students experiencing food insecurity were more likely to have exhausted their meal plans if they had purchased one, and meal plan exhaustion may be correlated with, or a potential indicator of, student food insecurity.
Similar to observations of other academic grade levels (i.e., K-12), academic performance is significantly reduced for students experiencing food insecurity.
The overall low rate of use of the Red Hawk Pantry requires further investigation, as only half of all respondents (54.6%) were aware that the service was available, and less than 1 in every 10 respondents had used the service (9.3%).
Students experiencing food insecurity reported having a more difficult time preparing meals to eat during the school day, purchasing meals off campus to eat on campus, and purchasing meals on campus. They also reported not having enough time to eat meals during the school day due to class schedules, and having to eat during class time.
Higher academic institutions are not invited, nor eligible, to participate in the Free / Reduced Price School Breakfast and Lunch programs; as a result these institutions do not receive any support to increase student access to meals, nor are the institutions required to follow the federal nutritional standards that come with program participation.
Students experiencing food insecurity were significantly more likely to report that the food available on campus was too expensive; they also reported a greater level of dissatisfaction with the quality and variety of foods available to purchase, compared to their food secure peers.
Student perceptions of the campus foodscape may be different based upon their level of food security, with students experiencing food insecurity having a more negative perception of the foodscape as a whole.
Differences in other perceptions of the foodscape however, may suggest that there is a lower level of self- efficacy experienced among students experiencing food insecurity.
Conclusion
The data suggest that presently over 4 in every 10 students who responded to the survey may be experiencing food insecurity during the academic semester, and that student food security may be worse for students during the academic semesters, when compared to their food security during the academic recess.
This audit sought to update and standardize the rudimentary data collected in 2016 prior to the opening of the Red Hawk Pantry. As a function of this standardization, results from the 2016 survey at Montclair State University may not be directly comparable to results from this 2019 survey, as different measurements were used; however, this data can be compared to other data using this standardized tool, and progress against this standardized baseline can now be measured.
Conservatively, if we are to count all respondents of the 2016 survey who indicated being in need of food at least once per month as food insecure, we might compare the 37% food insecurity prevalence in 2016 to 43.6% food insecurity prevalence in 2019. Conversely, we may more reliably compare persons who reported no food insecurity; 46% of respondents reported no problems with food access in 2016 as compared to 38.7% with no problems with food access in 2019. It may be difficult to determine if food insecurity has indeed gotten worse for students at Montclair State University, or if the data now just more accurately reflect the needs of our students.