
Tracking forest biomass and disturbance with NASA’s MISR
Dr. Mark Chopping, Professor, Earth and Environmental Studies, and colleagues have published NASA-funded research to map aboveground biomass and disturbance in southwestern forests using multi-angle imaging.
Posted in: Research
Our forests provide food, fuel, fibre, fun (!), wildlife habitat, carbon storage, and heat mitigation – but they are under threat in many parts of the U.S., including the arid southwest. This is a region of astonishing, if stark, natural beauty: from high desert grasslands dotted with mesquite and creosotebush shrubs, ocotillo, saguaro, and yucca elata, through riparian woodlands and mixed forest, to soaring needeleaf forests higher in the mountains. People moving to this sunny region from other parts of the US often buy or build homes in or closely adjacent to these forests and they are a favorite summer vacation destination for locals: as the climate warms, the relatively cool upland forest provides some respite from the increasingly searing summer heat.
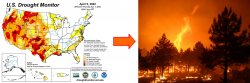
However, the climate is also drying. Warming and drying, together with decades of fire suppression and widespread bark beetle outbreaks from the mid-2000s, have made these forests increasingly prone to wildfires – and those fires are now burning hotter and more destructively. Pick any month and year in recent history and check the U.S. Drought Monitor and you will see that the monthly maps are not an aberration: the western US is drying up. Warmer springs mean the mountain snowpack that used to keep the forests moist until early summer now melt away in spring. Drier conditions mean that fires now burn hotter and tend to be “stand destroyers”: instead of clearing out the undergrowth and leaving the established trees alive, the forest is now burned to a crisp. The trees are killed and soils are seared, making it harder for saplings to take root. This does not bode well for the future of these forests.
Why do we care? Well, interactions between people, forests, and the climate do not always result in slow changes: if tipping points are reached, the system can flip suddenly to a different stable state, one that is far less friendly to people; and what happens in this region has impacts much further afield. For example, in recent years, smoke from western wildfires has started to impact the air in our region; see this July 2021 MSU news article. We thus have to monitor at scale: we need to zoom out and see the big picture – and this is what remote sensing from orbiting satellites allows. Scientists and forest managers also want to know how much carbon is lost (or gained) in forests, but losses cannot be measured after the forest has burned, or died from bark beetle infestations or disease, or been harvested (collectively: “disturbance”).
You might think that we could use the kind of satellite images seen in Google Earth to do this, or perhaps imagery from the long-running Landsat series of multispectral sensors. Both kinds of imagers provide pictures of the surface using sunlight reflected at several wavelengths, including in the blue, green, red, and near-infrared. However, clouds and infrequent viewing mean that, until recently, Google Earth imagery does not provide wall-to-wall coverage; and the imagery provided by both kinds of sensors is very sensitive to the condition of leaves: in a wet year, leaves will be more green, making it difficult to estimate forest carbon storage from year to year reliably. Recently we have started to use radar (radio detection and ranging) and lidar (light detection and ranging) to map and monitor forest carbon stocks. These advanced, active sensing technologies are excellent for this application; however, their records to date are patchy and too short.
There is another way to estimate forest carbon: exploit observations of reflected sunlight made at different angles relative to the sun direction. Because 3-D objects like trees cast shadows and scatter light in different directions, their presence, size, and spacing affects satellite readings made at different, oblique viewing angles, so we can use the difference to infer surface properties. The Google Earth and Landsat sensors can’t help here: they view almost straight down, towards the center of the Earth. However, in 2000 NASA launched a satellite called Terra that carries five instruments, including the Multi-angle Imaging Spectro-Radiometer (MISR). MISR was developed by the Jet Propulsion Laboratory that you may associate with the Mars rover missions. The MISR acronym is a typical JPL riff: the “miserly” satellite imager has only four spectral bands, vs the 224 of JPL’s “greedy” AVIRIS (Advanced Visible Infra-Red Imaging Spectrometer) airborne imager (that is clearly avaricious!). Here’s a picture showing how the nine MISR multispectral cameras view in front of (forward), straight down (nadir), and behind (aftward of) the satellite.
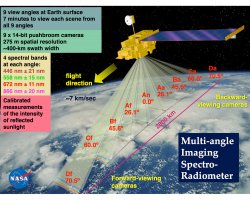
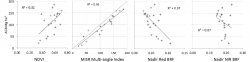
MISR was designed to measure properties of the atmosphere such as aerosols, clouds, and winds – it gathers measurements from its 9 cameras in about 7 minutes, before air masses move – but its observations can also be used to estimate ice sheet surface roughness and forest woody aboveground biomass (AGB; that is, the mass of wood in the aboveground parts of trees that is about 50% carbon). Tests showed that combining measurements of reflected red light (the kind that plants like to use for photosynthesis) from three of MISR’s cameras in a ratio provides a metric – a multi-angle index – that is strongly related to forest biomass. If we try to use the more traditional remote sensing approach of combining single-angle red and near-infrared (NIR) measurements into a multi-spectral index, such as the Normalized Difference Vegetation Index (NDVI), or use those measurements separately, estimates of AGB vs reference data are likely to be quite poor, with R2 < 0.4, vs 0.9 for the multi-angle index (see plots).
What about those pesky clouds? MISR can deal with clouds because it acquires imagery over a ~400 km wide swath, providing repeat viewing of any location within 8 days. This is sufficiently frequent for the construction of cloud-free composites.
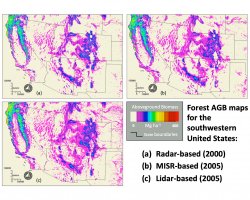
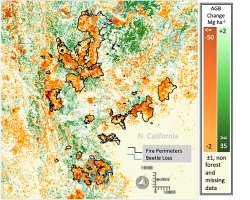
AGB maps made using the multi-angle index match those available from satellite radar (2000) and lidar (2005) very well (right), allowing us to create annual time series from 2000 onwards. MISR AGB estimates were also consistent with highly reliable NASA Carbon Monitoring System airborne lidar-derived estimates for the Rim Fire area in California. The distribution of forest losses from fire and beetle disturbance in 2015 over 2000 also matched historical data in published sources.
We hope these map series will help ecologists and foresters to improve our understanding of the changes we are seeing in southwestern forests; and how the progression of these changes might affect people living in this region in the coming decades as the regional climate warms and dries.
Citation: Chopping, M., Wang, Z., Schaaf, C., Bull, M.A., and Duchesne, R.R. (2022), Forest aboveground biomass in the southwestern United States from a MISR multi-angle index, 2000–2015, Remote Sensing of Environment, 275, 112964, ISSN 0034-4257, https://doi.org/10.1016/j.rse.2022.112964.