Workday Mobile Application Instructions (PDF)
Workday delivers cloud-based information to your fingertips using mobile devices such as phones and tablets. Download and setup instructions are provided below.
The Workday app:
- Provides secure, mobile access to your Workday applications on-the-go.
- Lets you view your notifications and tasks that require your attention and immediate action.
- Helps you stay connected to your work by gaining quick insight into what’s important through interactive reports and dashboards.
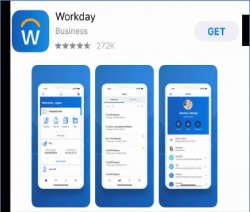
Download now!
Setup Instructions
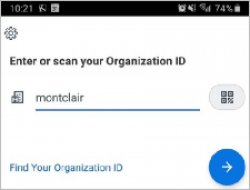
Launch the application and press the login button

Type “Montclair” and click to Find Your Organization ID. This will lead you to a single sign-on page.
Enter your NetID and password
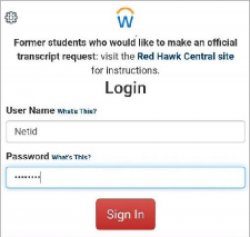
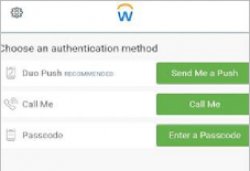
You will need to verify the sign-on
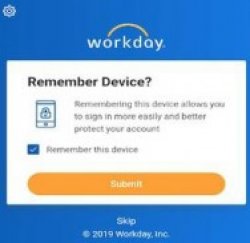
Click the “remember this device” checkbox if you are using a trusted device (optional)
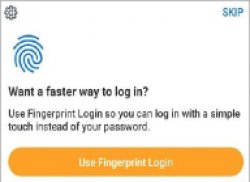
You can set up your fingerprint to log in faster (optional)
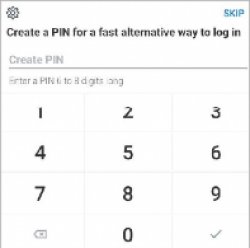
You can set up a pin to log in (optional)
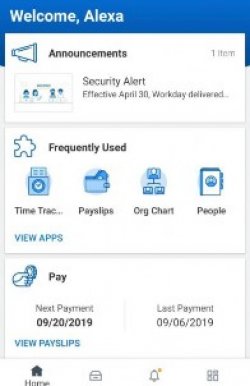
You will arrive at the Welcome screen
Those in a Management Chain in Workday have visibility to job requisitions and candidate information; however, they cannot take action (i.e. disposition, move forward, bundle resumes, etc.) on the candidate.
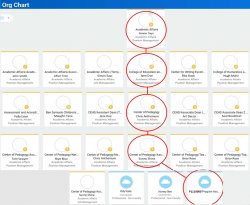
The Management Chain in Workday is dependent on the alignment of Workday’s Supervisory Orgs.
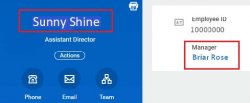
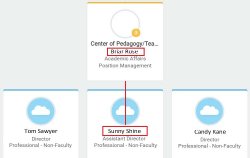
People/positions are in blue and roll into one Supervisory Org. People/positions show the employee’s name (name will be blank if the position is unfilled) listed at the top, then the position title and position classification.
Supervisory Orgs are in orange. Supervisory Orgs show the name of the Supervisory Org at the top, then list the Org’s Manager and name of the Division. One person may have multiple Supervisory Orgs under their name.
Example: Briar Rose is Sunny Shine’s Manager, but Briar does not have access to R1111111. This is because the open position (P1001111) is in an org that roles up to Chris Anthemum, not Briar Rose. The Management Chain for R1111111 is Simon Says, Jane Doe, Chris Anthemum, and Sunny Shine.
By default, you will receive an email notification for each Workday task and/or approval assigned to you. You can choose to receive email notifications immediately or receive one email notification per day – daily digest. The daily digest will include a list of all the items awaiting your review or action. The daily digest is sent at 12:00 pm daily.
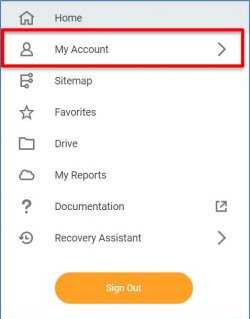
1) From the Workday Homepage, click the cloud icon in the top right corner.
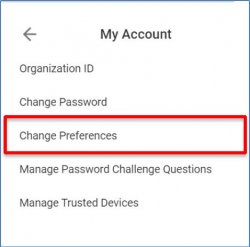
2) Click on My Account and then click Change Preferences.
3) Scroll down to the Channel section.
4) Browse through the Notification Types for those you wish to change the notification frequency.
5) Click the prompt icon in the Frequency field and select the frequency you would like to receive notifications.
- Immediately:
- notifications are delivered immediately to your MSU email
- Daily:
- an email digest with all tasks will be sent to your MSU email at 12:00 pm ET
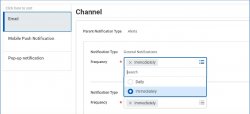
6) Click OK.
Inbox filters are customizable filters that allow you to quickly sift through all of the items in your Workday Inbox.
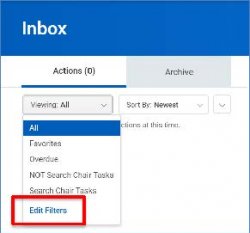
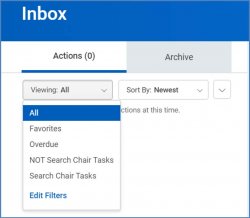
1) From the Workday Homepage, click on the Inbox in the top right corner.
2) Click the Viewing dropdown and select Edit Filters.
3) Click Create Inbox Filter.
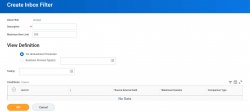
4) Enter a meaningful description of the filter you are creating in the Description field.
5) Leave the Maximum Row Limit at 200. This is how many records at a time will be returned.
6) Under View Definition, select whether you want to return all business processes or a specific kind.
7) Tasks include actions in the system such as Approvals, To Do’s, etc. Click the prompt icon and select a task(s) if you wish to sort by the task type.
8) Conditions will add one or more conditions to your filters. Click the + if you wish to add conditions.
9) Click OK.
1) From the Workday Homepage, click on the Inbox in the top right corner.
2) Click the Viewing dropdown and select the filter you created from the list.
Workday provides a way to view reports by specific functional areas. There are several dashboards available that can provide access to data via delivered reports and charts. To access the dashboard functions follow the steps listed below.
-
In the top right-hand corner, under the inbox, click on the gear (wheel) icon
-
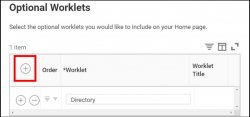
Under Optional Worklets, click on the plus sign, next to the word order at the top of the chart
-
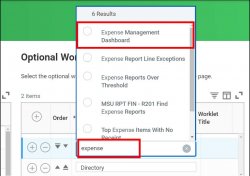
A blank box appears, type the name of the dashboard that you are searching for (e.g. Recruiting, My Staffing Actions), then select the dashboard.
-
Click ‘OK’, then ‘done’
Dashboards are pre-configured pages related to functional areas within Workday. They are populated with related charts and data. Some may also include related tasks, menus, and announcements. In Workday, data can be entered using “tasks” and viewed using “reports.”
The Workday Home page displays worklet icons that provide access to tasks and reports in the Applications section. There are 6 required applications which are assigned to all user in Workday. Based on your specific roles in the system, your Applications section may have more than the standard applications included. Note – Regardless of how many defaulted worklets are in the Application section, a maximum of 20 worklets can be displayed at any given time.
Note: Some dashboards may not allow the end user to remove or add applications. This will vary based on MSU’s security settings.
1) From the Homepage, click the Settings icon.
2) Under Optional Worklets, click the Add Row icon to add a new application.
3) Click the Prompt icon and select All to view the list of existing applications, or type the name of the application in the search field.
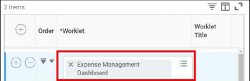
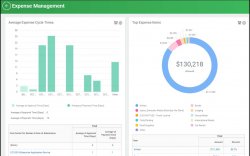
4) Select the application or dashboard to be added. For this example we will be adding the Expense Management Dashboard by typing expense in the search field.
5) Click the Move Row Up or Move Row Down arrow to reorder the applications on the page.
6) Click OK at the bottom of the screen.
7) Click Done at the bottom of the screen to be directed back to the Homepage.
8) Under the Applications section, check to see if the application has been successfully added. Click the newly added application to be directed to the dashboard.
The dashboard displays data related to the specific area. Each window in the dashboard helps to analyze the data from different points of view.
Reports, tasks, or business objects (cost centers, employees, organizations) that are used often can be added to your favorites. Favorites can be found in the Favorites application or under favorites in the profile menu.
IMPORTANT: The Favorites application does not automatically appear and needs to be added manually. The Favorites application can be added following the steps in the Configure the Homepage Dashboard section above.
To add to Favorites, follow the steps below:
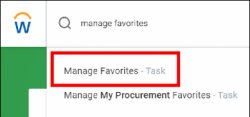
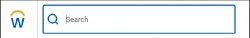
1) Enter Manage Favorites into the Search bar and select it from the results.
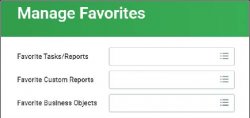
2) From the Manage Favorites screen, click the menu prompts in the Favorite Tasks/Reports, Favorite Customer Reports or Favorite Business Objects to browse available items. Another option is to type the name of an item and hit enter.
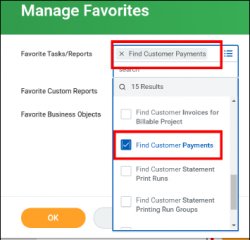
3) Click on the item browsed or typed to add it to the field(s). For this example, we will be adding the Find Customer Payments for Organization report.
4) Click OK at the bottom of the screen, then click Done.
The report appears when the Favorites application is opened.
Workday provides numerous Standard Reports which can be adjusted to fit the end-user needs. These reports can be exported to Excel in order to work with the data or can be filtered and saved within Workday. Reports appear on Dashboards using live data which can be drilled into. This provides the end-user with real-time, accurate data to assist with the completion of business processes and data analysis. There are also Custom Reports by Functional Area within Workday that have been configured based on MSU specific needs and business processes.
Access Standard Reports
1) From the Search field, search keywords or the name of the report.
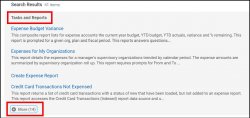
2) Under the Tasks and Reports section, locate & click the name of the report to be run. Note: Select More to expand the list of search results.
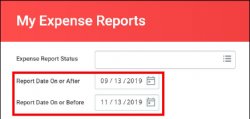
3) Depending on the report, enter parameters if applicable. For example, when running the My Expense Reports report, the report can be filtered down by Expense Report Status. Or, this field can be left blank to show all expense reports within the specified date range.
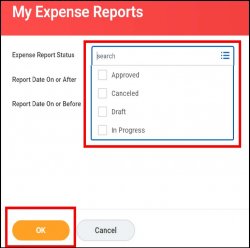
4) Click OK to view the report.
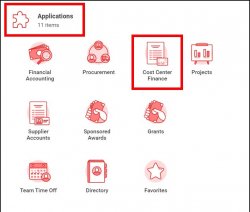
1) From the Homepage, under the Applications section, click the Application icon related to the functional area. For this example, we will access the reports related to the Cost Center Finance which will be used by Requisitioners.
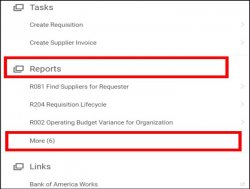
2) On the right-side of the screen, under Reports, is a list of reports related to this functional area that are frequently used in relation to business processes. Note: Click More in the Reports list to expand and view the full list of reports available.
You can easily manipulate the information that displays in your selected report, including filtering the information and exporting the list to Excel. You can also choose to have the report exported as a .pdf so that you can print it out.
Exporting a Report to Excel
1) From within the report, in the upper right corner of the report, click on either one of the two Excel icons.
Note: If you click on the top icon, you will get the entire header of the report. If you click the bottom icon, you will only get the header row of the report.
2) The entire report exports into an Excel worksheet. If it displays as minimized on the Task Bar at the bottom of the screen within the browser, click the Excel icon to open the file.
Printing a Report
1) From within the report, click the Print icon.
2) Workday exports the report as a .pdf. If it displays as minimized on the Task Bar, click the .pdf icon to open the file.
Saving a Favorite Filter
If you repeatedly run reports using the same filter data, you may save the filter setting in order to save time.
Note – While saving filter settings is available in many of the Workday reports, not all reports allow this functionality.
1) Select the parameters of a report.
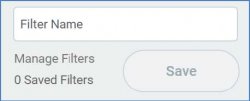
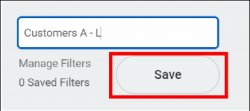
2) Scroll to the bottom of the page (DO NOT run report), and in the Saved filters section, enter a name for the filter in the Filter Name field.
3) Click the Save button.
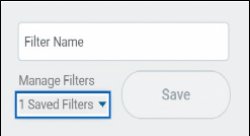
The newly saved filter appears in the Saved Filters list.
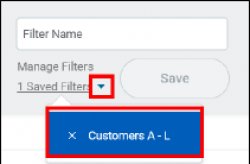
4) Click the down arrow to expand/view/use saved filters.
Filtering a Report
Once a report has been run in Workday, you may want to focus on some specific data. You can filter the displayed information of a report based on data within the report.
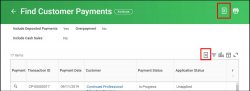
1) From within the report, click the Filter icon.
2) Click Add
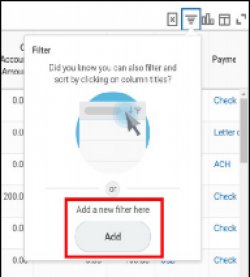
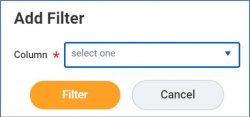
3) Select the column to filter the report from the dropdown menu. Note: Filters can be applied to multiple fields.
4) After selecting the filter criteria (for this example we used Payment), click Filter.
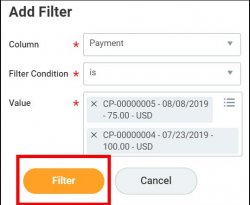
The report automatically displays the data based on the filtered criteria.
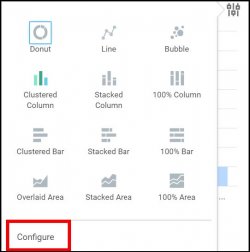
Adding a Chart to a Report
1) From within the report, click the Expand/Collapse Chart icon.
A default chart is displayed above the report.
2) Click the Configure icon to change the chart type.
3) Additionally, click the Configure link to change the variables contained in the chart.